Acridine Orange Fluorescent Staining Solution

For fluorescence microscopy and flow cytometry analysis of cellular physiology and cell cycle status. It may be used in conjunction with other stains / fluorogenic substrates including our Magic Red® products. Can also be used as a bacterial stain.
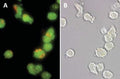

Figure 1. Normal Jurkat cells stained with Acridine Orange (AO) show orange lysosomal staining. Cells were stained with 5 µM AO in PBS for 60 minutes at 37°C. Photomicrographs were taken using a Nikon Eclipse E800 photomicroscope using a 460-500 nm excitation filter and a 505-560 nm emission / barrier filter set at 300X. Photo B shows the corresponding DIC image of the cells in A (AO appears faintly). Data courtesy of Dr. Zbigniew Darzynkiewicz (Brander Cancer Research Institute, New York, NY).
Click on image to zoom
Ships: 1-2 business days
- AO may be used neat or diluted in diH2O, PBS, or media. ICT’s AO is supplied at 0.5 mL liquid at 1 mM (266 µg/mL). 2. Add AO to the cell sample media at 0.5-5 µM, equal to a final dilution of 1:2,000 – 1:200 in the cells (.05-.5% v/v). For example, if using AO at 1.0 µM in the final cell suspension, it must be diluted 1:1,000. First dilute it 1:100 in PBS or diH2O; e.g., put 10 µL AO into 990 µL PBS or diH2O. Pipette the diluted AO into the cell suspension at approximately 1:10; e.g., put 50 µL diluted AO into 450 µL cell suspension.
- Incubate 15-30 minutes at 37°C.
- Wash cells if reagent is too bright.
- Analyze with fluorescence. Lysosomes will appear yellowish green by illuminating cells with a blue light (488 nm) excitation filter and a green light (540-550 nm) emission/barrier filter. Alternatively, lysosomes will appear red when using an excitation filter of 550 nm (540-560 nm) and a long pass >610 nm emission/barrier filter.
Product Specific References
| PMID | Publication |
| 39592718 | Zook, E., et al. 2024. Delayed vacuolation in mammalian cells caused by hypotonicity and ion loss. Scientific Reports, 29354. |
| 39442680 | Kim, NY, et al. 2024. Isoxazole based nucleosides induce autophagy through the production of ROS and the suppression of the β-catenin pathway in human colorectal carcinoma cells. Chemico-biological Interactions, 111285. |
| 39257214 | Yoon, B., et al. 2024. Thiouracil and triazole conjugate induces autophagy through the downregulation of Wnt/β-catenin signaling pathway in human breast cancer cells. IUBMB Life, . |
| 38741129 | Du, J., et al. 2024. Lysosomal dysfunction and overload of nucleosides in thymidine phosphorylase deficiency of MNGIE. Journal of translational medicine, 449. |
| 38659494 | Walmsley, R, et al. 2024. Sunitinib malate induces cell death in adult human cardiac progenitor cells. Current research in toxicology, 100167. |
| 38441406 | Vinik, Y, et al. 2024. Programming a Ferroptosis-to-Apoptosis Transition Landscape Revealed Ferroptosis Biomarkers and Repressors for Cancer Therapy. Advanced science (Weinheim, Baden-Wurttemberg, Germany), e2307263. |
| 35087718 | Matthaiou, EI, et al. 2022. TEM1-targeting PEGylated PLGA shikonin nanoformulation for immunomodulation and eradication of ovarian cancer. BioImpacts: BI, 65-86. |
| 35429112 | Duarte, C, et al. 2022. Crosstalk between dihydroceramides produced by Porphyromonas gingivalis and host lysosomal cathepsin B in the promotion of osteoclastogenesis. Journal of cellular and molecular medicine . |
| 35654241 | Kim, NY, et al. 2022. Tanshinone IIA exerts autophagic cell death through down-regulation of β-catenin in renal cell carcinoma cells. Biochimie. |